R 色彩 详解与实例
要点: R中的色彩很丰富,灵活运用才能提高图片的美感和区分度。本文前面是色彩理论和实例,后面是R中相关函数。
A programmer who subconsciously views himself as an artist will enjoy what he does and will do it better. —— Donald E. Knuth 1978
简书笔记:
论文figure色彩实例 - 权衡美观与区分度 |
[推荐]R语言中的渐变色 |
史上最全的图表色彩运用原理
色彩理论知识
SCI 图片用色的基本原则
sci图片的目标: 整洁干净、简洁漂亮。
- 同一篇文章的图片颜色要注意色调的整体性,不宜出现特别鲜明刺眼的颜色(尤其是荧光绿)
- 避免使用红绿,照顾色盲读者。可以使用红蓝代替。
- 如果不确定哪个颜色好看,不妨先试试色彩组合: 海军蓝"navy", 砖红"firebrick3"。
- 同一张图片色系最好统一,看起来会更加协调。
- 同一个指标在全篇图片中最好都使用同一个颜色贯彻始终。
- 一般用红色表示上调,绿色/蓝色表示下调。
- 可以用渐变色来表示程度,颜色越深越多,颜色越浅越少,能够使数据显示更加直观。
以上,就是 SCI 图片用色上的一些小技巧。
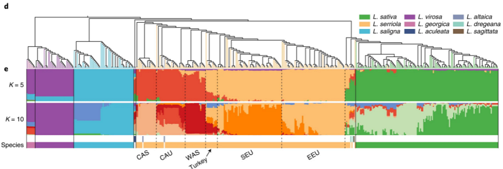
Nature Genetics 2016年发表一篇关于包菜的研究文章,使用了很多颜色,怎么配色的?首先尽量避免扎眼的颜色,色彩的亮度要减少,以显得柔和,暖色系和冷色系要分开。是不是觉得很干净,很好看?
更复杂一些的,比如关于互补色、对比色的使用等颜色搭配相关的进阶知识,感兴趣的可以自行查看学习,对 SCI 图片或者是 PPT 的制作都是很有帮助的。
色彩常用语名词解释
可以直接用色轮中的相邻色和互补色确定主色。可以阅读 STHA.com 教程: choosing-colors-for-great-data-visualization-in-r
color palettes
color wheels
color schemes
color psychology
单色(hue相同,饱和度不同)Monochromatic schemes use different tones from the same angle on the color wheel (the same hue).
相似色 Analogous color schemes are created by using colors that are next to each other on the color wheel.
互补色(hue在色轮两端) Complementary schemes are created by combining colors from opposite sides of the color wheel.
三色系 Triadic schemes are made up of hues equally spaced around color wheel.
复合方案 Compound schemes are almost the same as complementary schemes.
Instead of using colors that are opposites, it uses colors on both sides of the opposite hue.
色彩列表
微软的四种颜色
Google的四种颜色
示意图色彩
10x单细胞示意图
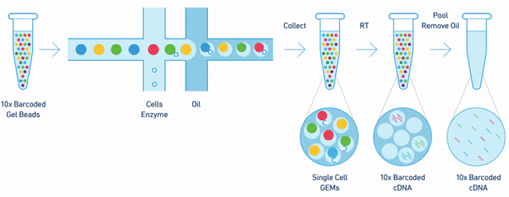
碱基颜色 1 (10x)
A
T
G
C
Red
Purple
Orange
碱基颜色 2 (其他来源)
A
T
G
C
IGV:A
IGV:T
IGV:G
IGV:C
Cell cycle 1
G1
Cyclin D
S
Cyclin E
G2
Cyclin A
M
Cyclin B
Cell cycle 2
G1
Cyclin D
S
Cyclin E
G2
Cyclin A
M
Cyclin B
Inter
phase
条形图色彩
条形图
pubmed id:29988129
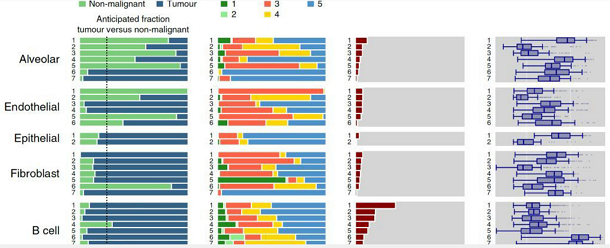
色块图
pubmed id:33846635
bar 色块提取1
#EE3523
#919135
#68CBDD
#F7921D
#029052
#902E8E
#323B97
#00B8F0
#EC188B
bar 色块提取2
item 01
item 02
item 03
item 04
item 05
item 06
item 07
色卡集合 (使用Canvas展示)
如果使用Chrome浏览器,可以按F12打开控制台Console, 鼠标单击颜色,控制台输出16进制(hex)颜色值; 双击则输出一整行unique color的hex值; 控制台带背景色的颜色字符可以复制粘贴。
小工具: 批量选取自己喜欢的颜色,
批量By色环 |
批量ByL |
批量ByS |
仿PS颜色设置 |
HSL取色工具(推荐) |
Color Palette 1: 生活中的色彩
Color Palette 2: CNS paper中单细胞可视化(tSNE/ UMAP/ heatmap/ boxplot) 经典配色
Color Palette 3: 财经杂志 商务图表 知名网站
Color Palette 4: HSL色彩模型
Color Palette 5: barplot/lineplot 等色彩搭配
Color Palette 6: 色盲友好的渐变色(viridis 包),前7个适合做热图配色
viridis / ˈvɪrɪdɪs / 翠绿色 |
csdn blog |
viridis R包 |
如何使用R语言画出漂亮的图,颜色很重要,既要协调,又要有一定的分辨力。
R原生的颜色请参考本站
R 颜色。
很好很强大的
R颜色列表.pdf。
All 657 colors In R.html, produced by script
getAllColors
R中目测查看几种颜色的区分度:
scales::show_col( c('red','blue', '#FF9600', '#0096FF') )
barplot(rep(1,4), col=c('red','blue', '#FF9600', '#0096FF'), border = NA)

library(scales)
show_col(viridis_pal()(16), labels = FALSE)
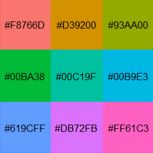
show_col(hue_pal()(9), borders = NA) #效果见下图

color.set1=scales::hue_pal()(9); color.set1 #Seurat 的默认颜色
# "#F8766D" "#D39200" "#93AA00" "#00BA38" "#00C19F" "#00B9E3" "#619CFF" "#DB72FB" "#FF61C3"
还可以使用 barplot() 及 image() 来预览颜色。
# 1.使用 barplot() 预览颜色
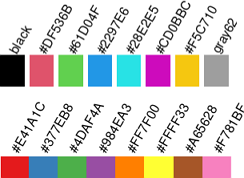
palette() # R4.0 默认调色盘相对 R3.6 下调了饱和度,看着更舒服。
#"black" "#DF536B" "#61D04F" "#2297E6" "#28E2E5" "#CD0BBC" "#F5C710" "gray62"
cols=palette()
par(mar=c(0,0,4,0))
posX=barplot(rep(1,8), col=cols, yaxt="n", border = NA)
text(posX, 1.05, labels=cols,
srt=60, adj=0,
col="black", xpd=T)
# 2.使用 image() 预览颜色
# 按照Set1的配色的前8种
par( mar=c(1,0,4,1))
library(RColorBrewer)
mypalette_1=brewer.pal(8,"Set1")
mypalette_1
# "#E41A1C" "#377EB8" "#4DAF4A" "#984EA3" "#FF7F00" "#FFFF33" "#A65628" "#F781BF"
image(1:8,1,as.matrix(1:8),col=mypalette_1,
xlab="Set1", ylab="", mgp=c(0.1,0.5,0),
xaxt="n",yaxt="n",bty="n")
par("usr")
text(1:8, par("usr")[4]*1.03, labels=mypalette_1,
srt=60, adj=0,
xpd=T,
col="black", xpd=T)
彩虹色
#可以拿到任意多个颜色,当然颜色越多,分辨力越低。
barplot(rep(1,8), col=rainbow(8),border=NA, axes=F)
rainbow(8)
# [1] "#FF0000FF" "#FFBF00FF" "#80FF00FF" "#00FF40FF" "#00FFFFFF" "#0040FFFF"
# [7] "#8000FFFF" "#FF00BFFF"
barplot(rep(1,20), col=rainbow(20),border=NA, axes=F) #分辨力降低
其他几个预置渐变色
par(mfrow=c(5,1), mar=c(0,0,2,0))
n=10
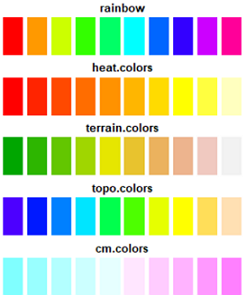
barplot(rep(1,n), col= rainbow(n), border=NA,axes=F, main="rainbow") #彩虹色
#heat.colors()从红色渐变到黄色,再变到白色
barplot(rep(1,n), col= heat.colors(n), border=NA,axes=F, main="heat.colors")
#terrain.colors() 从绿色渐变到黄色,再到棕色,最后到白色
barplot(rep(1,n),col=terrain.colors(n), border=NA,axes=F, main="terrain.colors")
#topo.colors() 从蓝色渐变到青色,再到黄色,最后到棕色
barplot(rep(1,n),col=topo.colors(n), border=NA,axes=F, main="topo.colors")
#cm.colors() 从青色渐变到白色,再到粉红色
barplot(rep(1,n),col=cm.colors(n), border=NA,axes=F, main="cm.colors")
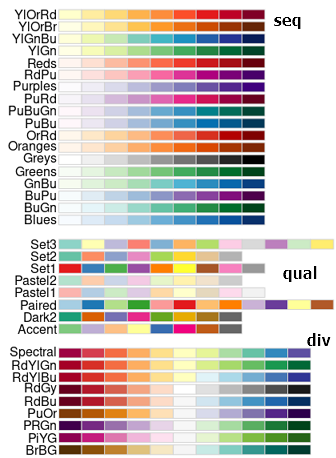
RColorBrewer 包中颜色板被划分为序列型(sequential)、离散型(diverging)、分类型(qualitative)这三种基本能满足统计作图需要的类型。
library(RColorBrewer)
display.brewer.all() #显示全部颜色集合
#"div", "qual", "seq", or "all"
display.brewer.all(type="seq") #Sequential 连续型,浅色数字小,深色数字大
display.brewer.all(type="qual") #Qualitative 定性的,适合分类变量
display.brewer.all(type="div") #Diverging 离散型,两端强对比,中间过渡自然
> RColorBrewer::brewer.pal.info #显示颜色信息表
         maxcolors category colorblind
BrBG            11      div       TRUE
PiYG            11      div       TRUE
PRGn            11      div       TRUE
PuOr            11      div       TRUE
RdBu            11      div       TRUE
RdGy            11      div      FALSE
RdYlBu          11      div       TRUE
RdYlGn          11      div      FALSE
Spectral        11      div      FALSE
Accent           8     qual      FALSE
Dark2            8     qual       TRUE
Paired          12     qual       TRUE
Pastel1          9     qual      FALSE
Pastel2          8     qual      FALSE
Set1             9     qual      FALSE
Set2             8     qual       TRUE
Set3            12     qual      FALSE
Blues            9      seq       TRUE
BuGn             9      seq       TRUE
BuPu             9      seq       TRUE
GnBu             9      seq       TRUE
Greens           9      seq       TRUE
Greys            9      seq       TRUE
Oranges          9      seq       TRUE
OrRd             9      seq       TRUE
PuBu             9      seq       TRUE
PuBuGn           9      seq       TRUE
PuRd             9      seq       TRUE
Purples          9      seq       TRUE
RdPu             9      seq       TRUE
Reds             9      seq       TRUE
YlGn             9      seq       TRUE
YlGnBu           9      seq       TRUE
YlOrBr           9      seq       TRUE
YlOrRd           9      seq       TRUE
brewer.pal(n, name) 获取颜色值
使用预置配色集合 Set2/Dark2,通过函数colorRampPalette()插值生成任意个渐变颜色。
# 我最喜欢中间这几组颜色了
display.brewer.all(type="qual") #见下图左
# 预览一个颜色集合,比如Dark2, Set2
display.brewer.pal(n = 8, name = 'RdBu')
csn='Dark2'
myColors=brewer.pal(8,csn) #该主题有8种颜色
par( mfrow=c(3,1), mar=c(0,1,1,0)) #bottom, left, top, right
barplot(rep(1,8),col= myColors, main=csn, axes=F,border=F) #见下图右row1

colorRampPalette() 插值,生成一组颜色
# 插值,8色生成15色: 见上图右row2,row3
n=15
colorN=colorRampPalette(colors = myColors, interpolate ="linear")( n )
barplot(rep(1, n ),col= colorN, axes=F, border=F,
main="linear") #插值方式
colorN2=colorRampPalette(colors = myColors, interpolate ="spline")( n )
barplot(rep(1, n ),col= colorN2, axes=F, border=F,
main="spline") #插值方式
colorRampPalette()函数使用方法:
# 推荐使用 LAB 色彩空间:三色渐变
Lab.palette = colorRampPalette(c("red", "orange", "blue"),
space = "Lab")
n=100; barplot(rep(1, n), col=Lab.palette(n), border = NA, space=0, axes=F)
# 从绿色到深绿色的渐变:双色渐变
fun_color_range = colorRampPalette(c("Green", "darkgreen"))
my_colors = fun_color_range(100)
# Plotting a graph
plot(1:100, pch = 20, col = my_colors)
# 合并成一行
image(volcano,
col = colorRampPalette(brewer.pal(9, "Purples"))(20),
main = "volcano")
plot(iris$Petal.Length, iris$Petal.With,
col = brewer.pal(3, "Set2")[iris$Species],
main = "iris")
Details: The CIE Lab color space is approximately perceptually uniform, and so gives smoother and more uniform color ramps. On the other hand, palettes that vary from one hue to another via white may have a more symmetrical appearance in RGB space.
The conversion formulas in this function do not appear to be completely accurate and the color ramp may not reach the extreme values in Lab space. Future changes in the R color model may change the colors produced with space = "Lab".
colorRamp()和colorRampPalette()的区别
两者都可用于建立颜色板,通过传入期望的主色,如蓝、紫,colorRamp()和colorRampPalette都返回一个函数。用等价的参数,结果是相同的,虽然 colorRamp()更繁琐一些。
colorRamp(colors, bias = 1, space = c("rgb", "Lab"), interpolate = c("linear", "spline"))
二者返回的函数区别为:
- colorRamp()返回的函数像grey()一样,参数为[0,1]之间的数列,数列中数字个数即为函数返回的颜色数,返回值是一行一个rgb格式的颜色。
- colorRampPalette()返回的参数则像rainbow()一样,参数为希望返回颜色板色彩的数量。

par(mfrow = c(1, 2), mar=c(0,0,1,0))
#1 colorRampPalette
b2p1 = colorRampPalette(c("blue", "purple")); b2p1 #返回的是一个函数
b2p1(3) #"#0000FF" "#5010F7" "#A020F0"
barplot(rep(1, 12), col = b2p1(12),
border = NA, space=0, axes=F, main = "colorRampPalette")
#2 colorRamp
b2p2 = colorRamp(c("blue", "purple")); b2p2 #返回的是一个函数
b2p2( c(0, 0.8) ) #输入是0-1之间的值,输出是一行一个rgb值
# [,1] [,2] [,3]
#[1,] 0 0.0 255
#[2,] 128 25.6 243
# 转换 colorRamp() 的输出,每一行对应为一个16进制颜色值(hex)
ramp2hex=function(ramp){
apply(ramp, 1, function(x){
rgb(x[1], x[2], x[3], maxColorValue = 255)
})
}
barplot(rep(1, 12), col = ramp2hex( b2p2(seq(0, 1, len = 12)) ),
border = NA, space=0, axes=F, main = "colorRamp")
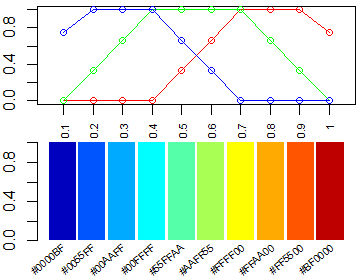
monocle2 包的pseudotime_heatmap的配色很显眼,十分值得借鉴。本文只关心渐变色生成部分。
整个图的画法请参考: 伪时间平滑化热图 plot_pseudotime_heatmap (仿monocle)
############### color bar from monocle::plot_pseudotime_heatmap ##############
# 这个 color bar 来自于monocle,画热图效果很好
height = 1
n=22; mid=0.75;sill=0.25;base=1
table.ramp = function (n, mid = 0.5, sill = 0.5, base = 1, height = 1) {
x <- seq(0, 1, length.out = n) #0-1之间取n个值
y <- rep(0, length(x)) #等长度的0
### 定义极值 sill
sill.min <- max( c(1, round( (n-1)*(mid-sill/2) ) + 1) ) #14
sill.max <- min( c(n, round( (n-1)*(mid+sill/2) ) + 1) ) #19
########## 替换0 平台期: 围绕mid的sill极值范围内的y取1
y[sill.min:sill.max] <- 1
y
### 定义 极值 base , 范围更宽
base.min <- round( (n-1)*(mid-base/2) ) + 1 #6
base.max <- round( (n-1)*(mid+base/2) ) + 1 #27
########## 替换1 上升部分
# xi是 still到base的min过渡态, yi则是等长的0-1之间的间距值
xi <- base.min:sill.min #[1] 6 7 8 9 10 11 12 13 14
yi <- seq(0, 1, length.out = length(xi))
# [1] 0.000 0.125 0.250 0.375 0.500 0.625 0.750 0.875 1.000
# 获取xi中大于0小于等于n的元素的下标
i <- which(xi > 0 & xi <= n) #[1] 1 2 3 4 5 6 7 8 9
y[xi[i]] <- yi[i] #让y在这些位置上[6,14],值等于yi
y
########## 替换2 下降部分
# xi是 still到base的max过渡态, yi则是等长的1-0之间的间距值
xi <- sill.max:base.max # [1] 19 20 21 22 23 24 25 26 27
yi <- seq(1, 0, length.out = length(xi))
#[1] 1.000 0.875 0.750 0.625 0.500 0.375 0.250 0.125 0.000
i <- which(xi > 0 & xi <= n) #[1] 1 2 3 4
y[xi[i]] <- yi[i]
y
height * y
# [1] 0.000 0.000 0.000 0.000 0.000 0.000 0.125 0.250 0.375 0.500 0.625 0.750 0.875
# [14] 1.000 1.000 1.000 1.000 1.000 1.000 0.875 0.750 0.625
}
height=1
n=10 #指定颜色个数
#do.call("table.ramp", as.list(c(n, c(0.8, 0.2, 1)))) #等价于
rr=table.ramp(n, 0.8,0.2,1); rr
#[1] 0.0000000 0.0000000 0.0000000 0.0000000 0.3333333 0.6666667 1.0000000
#[8] 1.0000000 1.0000000 0.7500000
gg=table.ramp(n, 0.5,0.4,1); gg
#[1] 0.0000000 0.3333333 0.6666667 1.0000000 1.0000000 1.0000000 1.0000000
#[8] 0.6666667 0.3333333 0.0000000
bb=table.ramp(n, 0.2,0.2,1); bb
#[1] 0.7500000 1.0000000 1.0000000 1.0000000 0.6666667 0.3333333 0.0000000
#[8] 0.0000000 0.0000000 0.0000000
par(mfrow=c(2,1), mar=c(2,2,0,1)) #b,l,t,r
plot(rr, xlim=c(0.5,n+0.5), ylim=c(0,1), type='o', col='red', xaxt='n')
axis(1, at=seq(1, n), labels=seq(1,n)/10, las=2,cex.axis=0.7)
lines(gg, col='green', type='o')
lines(bb, col='blue', type='o')
#
hmcols=rgb(rr, gg, bb)
hmcols
#[1] "#0000BF" "#0055FF" "#00AAFF" "#00FFFF" "#55FFAA" "#AAFF55" "#FFFF00"
#[8] "#FFAA00" "#FF5500" "#BF0000"
#color.rs=rainbow(60)
posX=barplot(rep(1,length(hmcols)), col=hmcols, border = NA, space=0.1)
text(posX, -0.05, labels=hmcols,
#col=hmcols,
xpd=TRUE, #允许绘制在绘图区外
cex=0.6, #字体是默认的倍数
adj=1, #adj=1右上对齐
srt=40) #倾斜30度)
CytoTRACE 包的 plotCytoTRACE 的配色很显眼,十分值得借鉴。本文只关心渐变色生成部分。

# 1. 主干11个颜色
temp=RColorBrewer::brewer.pal(11, "Spectral");temp
# "#9E0142" "#D53E4F" "#F46D43" "#FDAE61" "#FEE08B" "#FFFFBF" "#E6F598" "#ABDDA4" "#66C2A5" "#3288BD" "#5E4FA2"
# 替换第6个为金色
temp[6] <- "gold"
# 2.插值:返回函数
rbPal <- colorRampPalette(temp)
# 3.获取n个颜色
n=100
cols <- rbPal( n ); cols
#####
# 2. 另一种插值方法:效果同上
if(0){
# hmcols=colorRamp(cols, bias = 1, space = c("rgb", "Lab"), interpolate = c("linear", "spline"))
hmcols_fn=colorRamp(temp, bias = 1, space = c("rgb"), interpolate = c("spline"))
ramp2hex=function(ramp){
apply(ramp, 1, function(x){
rgb(x[1], x[2], x[3], maxColorValue = 255)
})
}
# 返回n个颜色
n=100
cols = ramp2hex( hmcols_fn(seq(0, 1, len = n))); cols
}
#####
# 4.可视化颜色
hmcols=rev(cols)
barplot(rep(1,length(hmcols)), col=hmcols, border = NA, space=0, yaxt="n")
########################
# Fig2. 对于cell cluster的颜色,可指定更少的n
temp=RColorBrewer::brewer.pal(11, "Spectral");temp
temp[6] <- "gold"
rbPal <- colorRampPalette(temp)
n=10
cols <- rbPal( n ); cols
hmcols=rev(cols)
barplot(rep(1,length(hmcols)), col=hmcols, border = NA, space=0, yaxt="n")
# 在 ggplot2中这样使用:
if(0){
data$Phenotype <- factor(data$Phenotype, levels = levels)
pheno_levels <- levels(data$Phenotype)
cols <- rbPal(length(pheno_levels))
names(cols) <- pheno_levels
p1 = ggplot2::ggplot(data, ggplot2::aes(x = emb[, 1], y = emb[, 2])) +
ggplot2::geom_point(ggplot2::aes(colour = Phenotype), size = ptsize) +
ggplot2::scale_colour_manual(values = cols,
guide = ggplot2::guide_legend(frame.colour = "black", override.aes = list(size = 4))
)+
...
}
连续型变量怎么和渐变色一一对应呢?
本例使用cut函数,实现了Y轴数字到渐变色的映射。
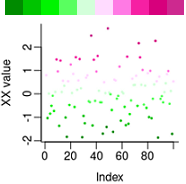
# cut函数: 把数值型转为因子型
#cut(x, breaks): Convert Numeric to Factor
# 1. 生成数据
set.seed(20211119)
dat_1=rnorm(100, 0, 1)
# 测试 cut 函数
total_bins=10 #定义渐变色的阶梯数,也是数据划分的组数
dat_2=cut(dat_1, breaks=total_bins) #可以传入整数,表示分成几份;或者传入截断点数组
#table(dat_2) #total_bins=5时的结果
# (-1.87,-0.935] (-0.935,-0.0025] (-0.0025,0.93] (0.93,1.86] (1.86,2.8]
# 18 26 37 15 4
# 2. 定义渐变色: 或 c('green4',"green1", "white",'maroon1', "maroon3")
colors2=colorRampPalette(
colors = c('green4', "white", "maroon3"),
interpolate ="spline") ( length(table(dat_2)) )
# 预览颜色(optional)
barplot(rep(1, length(colors2)), col=colors2, yaxt="n", space=0, border = NA)
# 3. 连续型变量dat和颜色colors2的映射
plotcol = colors2[ dat_2 ]; plotcol[1:5]
# 4. 画图
plot(dat_1, pch=20, mgp=c(2,0.5,0),
col=plotcol, cex=0.5,
bty="l", ylab="XX value")
Colors_(ggplot2)
离散变量的颜色:
scale_fill_brewer(palette = "Set1")
scale_fill_manual(values=c(c = "red", d = "blue", e = "green" , p = "orange", r = "yellow")) #为每个 fill 值指定颜色
scale_fill_brewer(palette = "Blues") #单一颜色


连续型变量
gradient 创建渐变色
distiller 使用ColorBrewer的颜色
	scale_color_distiller(palette = "Set1")
identity 使用color变量对应的颜色,对离散型和连续型都有效

scale_color_gradient 双色渐变(低-高)
	scale_colour_gradient(low = "green", high = "red")
scale_color_gradient2 发散颜色渐变(低-中-高)
	scale_color_gradient2(low = "navy", mid = "white", high =  "red")
scale_color_gradientn 创建n色渐变
	scale_color_gradientn(colours =rainbow(10))
100 color combinations and how to apply them to your designs
Color Wheel: Want to know what colors look good together? Canva's Color Wheel makes color combinations easy.
Color Palette Generator
Color Palette Ideas
最佳多色(n>10)配色程序: https://medialab.github.io/iwanthue/


更多配色方案
1. 花瓣网(https://huaban.com/)搜索「色卡」,查找别人上传的各种配色方案的卡片。
	很多色板Trending color palettes https://coolors.co/palettes/trending
2. Curated color palette inspiration. https://www.webdesignrankings.com/resources/lolcolors/
3. https://colorhunt.co/
4. https://vanschneider.com/colors
5. https://www.canva.com/learn/100-color-combinations/
6. https://color.adobe.com/zh/create/color-wheel
	https://www.sessions.edu/color-calculator/
	https://colorbrewer2.org/#type=sequential&scheme=BuGn&n=3

7. 如何创建和谐的颜色
https://www.sensationalcolor.com/creating-color-harmony/

8. D3 demo 用到的颜色 https://github.com/d3/d3/wiki/Gallery


9. 对图片的颜色进行聚类 http://www.cssdrive.com/imagepalette/

10.R中的颜色 https://qinqianshan.com/r_code/r_draw/colors-in-r/

11. 色盲色
How to make figures and presentations that are friendly to Colorblind people: https://jfly.uni-koeln.de/color/

http://color.biaozhiku.com/


